Dear Readers,
Trust you are doing well,
Today I am writing this post related to recent issue which we faced on one of the critical database post switchover to standby site. When I was checking AWR comparison reports to do some sanity checks, I found write IO statistics were increased significantly. Some of these number looks unreal as there was no change in application transaction volume.
One more thing we noticed post switchover is that we had intermittent DB session spikes for wait event “Library cache load lock” as due to some application server misconfiguration, logons per seconds were drastically increased on DR site.
PFB snippet from AWR comparison report wherein base snap is taken for before switchover window while second snap is for after switchover window.

We can clearly see though redo size is not changed much, physical write (blocks) & write IO (MB) stats were increased by 475% while write IO requests increased by more than 900%. These number were definitely very high & needed thorough investigation.
Logon/user logons per seconds were also increased by 500% but we didn’t see much difference in number of transaction or SQL executions.
When we checked further statistics from AWR, we found some interesting numbers.
SYSTEM I/O was a top contributor in wait classes & wait event “DB file async I/O submit” & “db file parallel write” were part of top list.


All following instance activity stats are significantly degraded, which has direct correlation with DBWR writing.
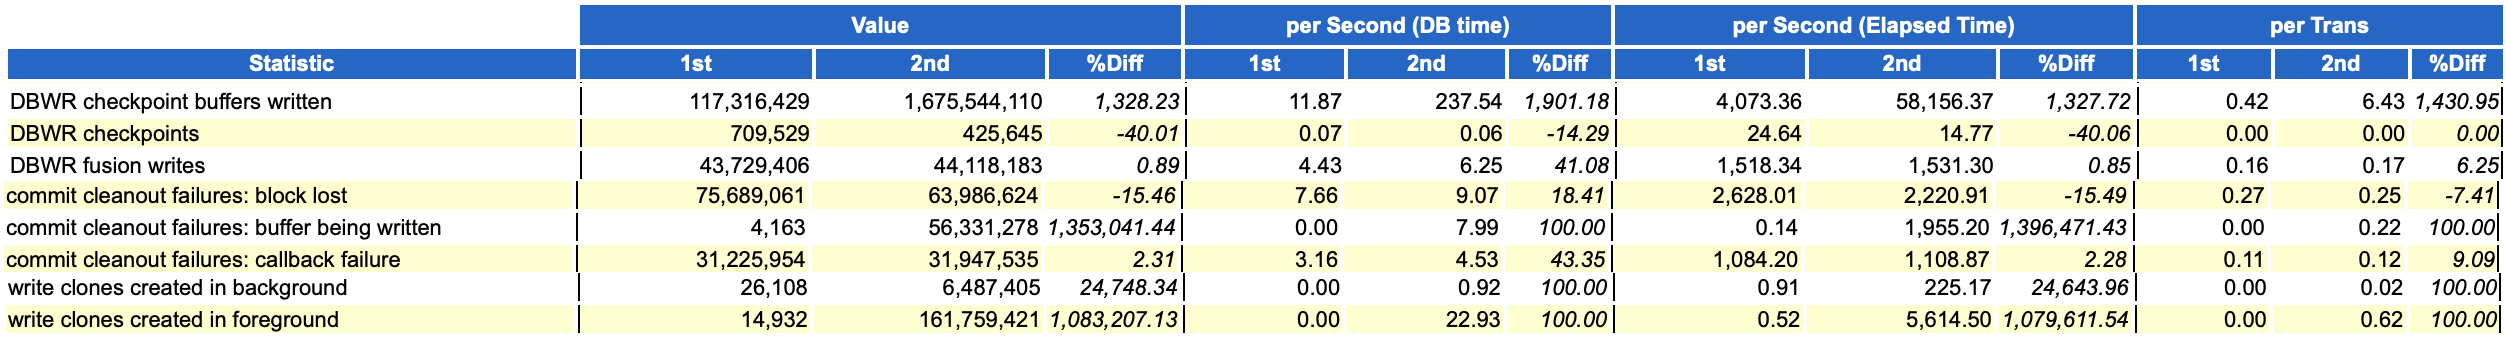
So question comes why there is excessive writing/aggressive DBWR behaviour though there is no change in transaction volume. I found some old Oracle bug which explains this weird behaviour.
kcbkcbc() calculate determines how many checkpoint buffers need to be written by DBWR in order to drive the total number of dirty buffers below the value of fast_start_io_target or the corresponding value derived from fast_start_mttr_target. Returns the target number of dirty buffers to write and the total number of dirty buffers found.
After buffer cache resize(shrink or grow) operations, total number of buffers was wrongly incremented to a very high value (due to some internal bug), this value made max dirty target for DBWR as 0.
Max dirty target =0 led that DBWR wrote dirty buffer as soon as finding dirty buffer.
When I checked gv$sga_dynamic_components view, it confirmed that there was DB cache adjustment muliple times since DR switchover.
All this memory adjustments were mostly done when there were DB spike with wait event “Library cache load lock”. This explains reason for DB cache/shared pool resize operation as well. The reason we observed this only on DR, as it has direct relation with excessive logons observed on standby site post switchover.
As a workaround, we can implement following measures:
1. Disable fast_start_mttr_target (fast_start_mttr_target to 0) which will disable automatic checkpoint tuning
2. Unset sga_target (sga_target to 0) which will disable automatic memory adjustments.
As of now we are discussing with Oracle development team to get permanent fix. I will update this post once we get permanent solution for the same.
In next blog post, I will talk about RCA on DB spike due to “Library cache load lock”
Hope u will find this post very useful!!!
Cheers
Regards,
Adityanath


Leave a comment